
Section 3: PRI Makers
Statistics about the Minnesota private foundations that made PRIs from 1998 to 2016
Annual PRI Participation Summary
The two charts below show the number and percentage of existing Minnesota private foundations with available Forms 990-PF that made at least one PRI in each fiscal year of the research period. Please note that, as can be seen in detail in Methodology Step 1, the total number of existing Minnesota private foundations with tax forms available changes significantly over the research period from a low of 601 in 1998 to a high of 1,470 in 2014. 2016 data is excluded here because it is incomplete and would distort the charts.
Number of MN Private Foundations
Making at Least One PRI
Per Fiscal Year

Percentage of MN Private Foundations
with Available Tax Forms
Making at Least One PRI
Per Fiscal Year

Key Takeaways:
- The number of Minnesota private foundations making at least one PRI in a given fiscal year has generally been increasing over the research period.
- The percentage of Minnesota private foundations with available tax forms making at least one PRI in a given fiscal year has remained mostly flat, or even declined slightly, signaling that the private foundation population has grown faster than the use of PRIs over time.
Annual PRI Activity by Foundation Name
The tables below (click image to enlarge) show each of the 39 Minnesota private foundations that our team identified as having made at least one PRI during the research period, along with the number of PRIs each foundation made each fiscal year (at left) and the total dollars each foundation deployed through PRIs each fiscal year (at right). These lists have been sorted highest to lowest based on the total number of PRIs made and the total PRI dollars deployed by each foundation over the entire research period. All dollar values below and in these tables have been adjusted for inflation, rounded to thousands, and presented in thousands (000’s).
Please note that, in most cases, blank cells in the following two tables indicate that a particular private foundation definitively did not make a PRI in that particular fiscal year, as determined by our research methodology. However, our team also left cells blank when we simply were not able to review a Form 990-PF for that private foundation in that fiscal year. This is especially relevant for fiscal year 2016 data since our research phase concluded before a number of these listed private foundations had submitted their 2016 tax forms.
Number of PRIs Made
Per Fiscal Year
by Foundation Name
Click image to enlarge.
PRI Dollars Invested
Per Fiscal Year
By Foundation Name
Click image to enlarge.
Key Takeaways for PRI Dollars (at right)
- Otto Bremer Trust deployed the most dollars in PRIs during the research period, approximately $46,762,000.
- The top 8 private foundations (~20%) account for ~74% of all the PRI dollars deployed during the research period.
- If the six charitable investments that were made by The McKnight Foundation from 2009-2015 but not officially reported as PRIs (see page 9) had been included in the dataset, then The McKnight Foundation would have invested the second highest dollar amount in PRIs with over $33 million.
Key Takeaways for # of PRIs (at left)
- Winds of Peace Foundation made the most PRIs during the research period, with 196.
- The top 8 private foundations (~20%) account for ~79% of all the PRIs made during the research period.
- Over half (54%) of the private foundations in our dataset made three or fewer PRIs during the period. Nine (~25%) made just one PRI during the period.
PRI Activity by Foundation Type
Private foundations are often classified as “corporate,” “family,” and “independent” foundations. While these categories are not legally defined or reported to the IRS on Form 990-PF, many foundations themselves use these identifiers, as does the field of philanthropy in general. To define these terms for this project, we started with the definitions provided by the Foundation Center in its Philanthropy Classification System (Endnote 12) and arrived at the following:
- “Corporate foundations” are private foundations associated with and whose funds are derived primarily from a for-profit corporation. A corporate foundation may maintain close ties with the for-profit corporation, but it is officially a separate and independent organization.
- “Family foundations” are private foundations whose funds are derived from members of a single family. Family members often serve as officers or board members of the foundation and have a significant role in grantmaking decisions. Family foundations are self-identified.
- An “independent foundation” is a private foundation managed by its own trustees or directors and that is not a corporate or family foundation.
To apply these terms to the private foundations in our dataset, we first looked at how each foundation identified itself in its name, its online presence, and its Form 990-PF. We also reviewed existing classifications on the Minnesota Council on Foundations (Endnote 13) membership page and in the “Foundation Stats” resource offered by Foundation Center. (Endnote 14) Finally, we also gave each private foundation in our dataset an opportunity to review and correct our designation.
The table below breaks down (1) the number of PRI-making Minnesota private foundations, (2) the number of PRIs, and (3) the dollars deployed in PRIs into these three categories. All dollars are adjusted for inflation.
PRI Activity by Foundation Type

Key Takeaways:
- Only 3 corporate foundations made one or more PRIs during the research period. 3M Foundation led the category with two PRIs totaling $3,040,000.
- Independent foundations conducted the most PRI activity during the research period, making 82.7% of PRIs and deploying 67% of PRI dollars.
PRI Activity by Foundation Location
The two charts below show the distribution of PRIs and PRI dollars by the location of the originating private foundation in the year the PRI was made. Foundation location is presented both by region and county, which were determined primarily using the address provided in the private foundation’s Form 990-PF for the year the PRI was made. In a limited number of cases, we used an alternate address from the Minnesota Secretary of State and the foundation’s GuideStar profile.
Percentage of PRIs
by Foundation County

Percentage of PRI Dollars
By Foundation County

Key Takeaways:
- Private foundations located in two Twin Cities counties, Ramsey and Hennepin, made half of all PRIs and deployed 75% of all PRI dollars.
- While only five private foundations in our dataset (13%) were located in Greater Minnesota in the year they made a PRI, these foundations made 47% of all PRIs and deployed 19% of all PRI dollars.
PRI Activity by Foundation Size
The graph below shows the percentage distribution of PRIs (in green) and PRI dollars (in grey) based on the size of the originating private foundation in the year the PRI was made. In this chart, a private foundation’s size is defined as the book value of its total assets at the beginning of the tax year in which the PRI was made as reported in Form 990-PF, Part II, Line 16, Column (a). All dollars are adjusted for inflation.
PERCENTAGE OF PRI's &
PERCENTAGE OF PRI DOLLARS
BY FOUNDATION SIZE
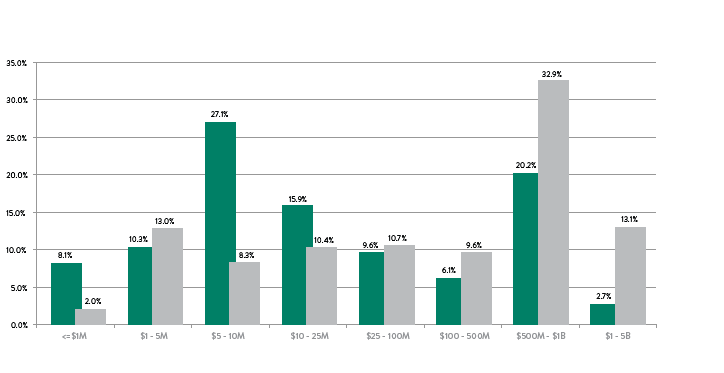

Key Takeaways:
- Minnesota private foundations of all sizes made PRIs.
- Nearly half of all PRIs (~46%) were made by private foundations with $10 million or less in assets.
- Nearly half of all PRI dollars (~46%) were deployed by private foundations with over $500 million in assets.
PRI Activity by Foundation Age
The graph below shows the percentage distribution of PRIs (in green) and PRI dollars (in grey) based on the age of the originating private foundation in the year the PRI was made. With a few exceptions, foundation age is calculated as the difference between the fiscal year in which the PRI was made and the private foundation’s IRS ruling year provided by GuideStar. All dollars are adjusted for inflation.
PERCENTAGE OF PRIs &
PERCENTAGE OF PRI DOLLARS
BY FOUNDATION AGE
IN YEAR MADE


Key Takeaways:
- Overall, the distribution of PRIs and PRI dollars by age is fairly even, meaning private foundations of all ages are using the tool.
- One reason for this fairly even distribution is that over our 19-year research period, a private foundation that makes PRIs regularly would appear in 2-3 different age categories.
PRI Activity by Foundation
Charitable Administrative Expenses
The graph below shows the percentage distribution of PRIs (in green) and PRI dollars (in grey) based on the amount of Charitable Administrative Expenses (CAE) reported by the originating private foundation in the year the PRI was made. The x-axis categories should be read from left to right as “CAE of $0,” then “CAE $1 to $10,000,” then “CAE $10,001 - $50,000,” and so forth. Please note that the scale of x-axis categories is not constant. CAE is based on the figure provided by each foundation in Form 990-PF, Part I, Line 24, Column (d). All dollars are adjusted for inflation.
Percentage of PRIs &
Percentage of PRI Dollars
By Foundation CAE In Year Made


Key Takeaways:
- Over 77% of PRIs and 74% of PRI Dollars originated from private foundations reporting more than $100,000 in CAE.
- While 80% of all MN private foundations reported less than $10,000 in CAE in 2014, only 15% of PRIs and 12% of PRI Dollars originated from foundations reporting less than $10,000 CAE.